Every lawyer with a laptop and ChatGPT is pumping out blogs. The internet is practically drowning in AI-generated slop.
So, why would a client pick your article out of that sea of sameness?
The truth is, people aren’t impressed with just any type of content marketing for lawyers.
They want answers to their questions. Answers that feel authentic, specific, and trustworthy. Your content has to prove (in seconds!) that you understand their situation better than anyone else.
Today, we’re breaking down 11 proven strategies to make content your #1 client source in 2026 and beyond.

What is Content Marketing for Law Firms?
Quite simply: What you’re reading right now is content!
It’s clear, engaging, and written in plain English. That’s the whole idea behind content marketing for law firms.
It means creating blogs, FAQs, videos, and more that address what your potential clients are typing into Google or AI tools like ChatGPT: “Do I need a lawyer for a DUI?” or “Find the best lawyer near me”.
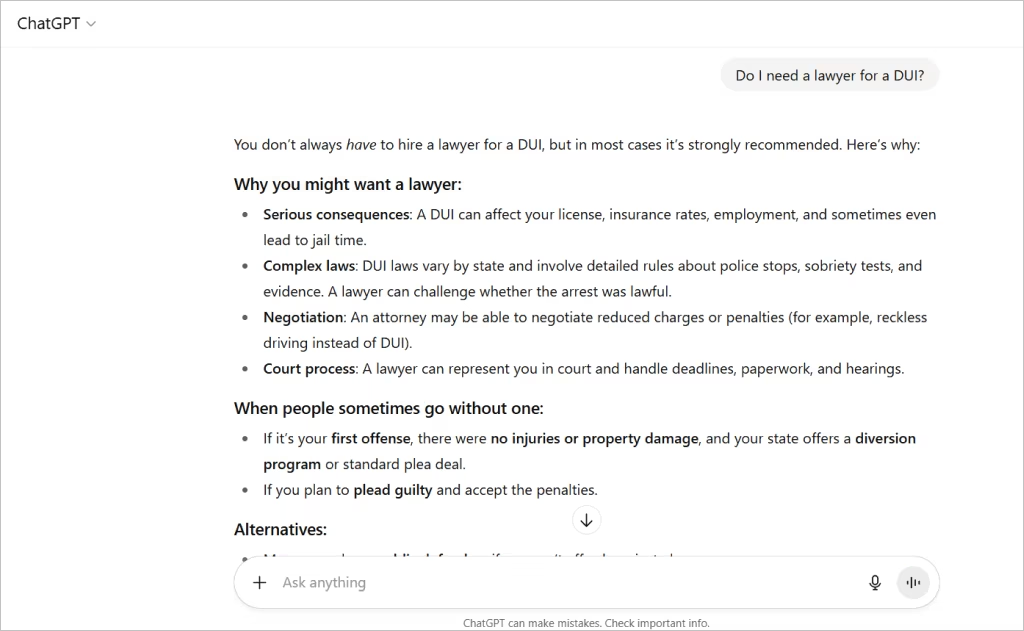
Sure, referrals and billboards still have their place, but they depend on timing and chance.
Content for lawyer websites, on the other hand, works 24/7 to meet people right when and where they’re searching for answers.
Why Legal Content Marketing Matters in 2026 (Proof & Benefits)
You could have the best legal team in the city, but if no one finds you, it doesn’t matter.
Enter: legal content marketing!
If you invest in creating great law firm website content today, you’ll be highly visible to potential clients in the future.
And the ROI is undeniable: Content marketing costs 62% less than traditional marketing and generates 3x more leads.
A solid content marketing effort builds visibility, visibility builds trust, and trust generates more leads (ka-ching!).
1. Define Your Law Firm Client Personas
Before you write a single word, ask: Who am I writing for?
- An injured worker might need an answer to “What if my workers’ comp claim gets denied?”
- A small business owner would want to know, “Do I need a lawyer to review a contract?”
- A family law client could be looking up, “How is custody decided in [my state]?”
Each persona has different fears, goals, and search habits. Defining them helps you choose the right keywords, tone, and examples.
Tip: Talk to your intake staff. The questions prospective clients ask on the phone are the same ones they’re typing into Google… and your content should answer them!
2. Build Your Content Marketing Strategy
If you want your content to work — i.e., attract the right people looking for legal assistance — you need a plan.
Remember, a strong content strategy doesn’t have to be complicated. You just need to follow a few smart steps.
Step 1: Set clear goals. Do you want more traffic? More calls? Better-qualified leads? Get specific. For example, a family law firm might aim for “20% more custody consultations within 8 months.”
Step 2: Pick the right formats. Different questions need different content.
- Blogs: “What if my workers’ comp claim is denied?”
- Videos: breaking down DUI penalties in plain English.
- Infographics: personal injury timelines at a glance.
- Reviews/case studies: proof that you win.
Step 3: Make it repeatable. Create a simple plan: who writes, where it’s published, and how results get tracked. Stick to a calendar… hey, even a spreadsheet works!
When you stay consistent with your digital marketing, your law firm website content compounds into a stream of high-value cases.
Ready to drive more consultations? Read our guide on how to execute law firm copywriting in 4 steps
3. Conduct Keyword Research for Lawyers
How do you know what to write… if you don’t know what people are searching for?
That was a trick question. You won’t! That’s why keyword research is your starting line.
Why long-tail keywords?
Would you rather compete for “accident lawyer” with 10,000 firms… or show up when someone types “What to do after a bike accident in Houston?” Long-tail keywords (specific, conversational searches) are easier to rank for and attract clients who are ready to act.
Bonus: they make up 70% of all web searches. You can capture quite a few high-intent clients simply by targeting long-tail keywords.
What tools should you use?
Check out SEMrush, Ahrefs, Ubersuggest, or Google Keyword Planner to see exactly what your audience is Googling.
How do you track success?
Track your keyword rankings monthly. Then go beyond positions — look at intent. Searches like “What happens after a DUI in Dallas?” show someone looking for information, while “DUI lawyer near me” signals they’re ready to hire.

Get Leads with Quality-Assured Content! At Comrade, your content is reviewed by an attorney for accuracy and impact.
4. Choose Content Types That Drive Engagement
Make sure your legal content is simple, clear, and tailored to the way real people search.
And the best part is, you’re not limited! There are multiple content types that the legal industry uses to boost client engagement.
Blog Posts
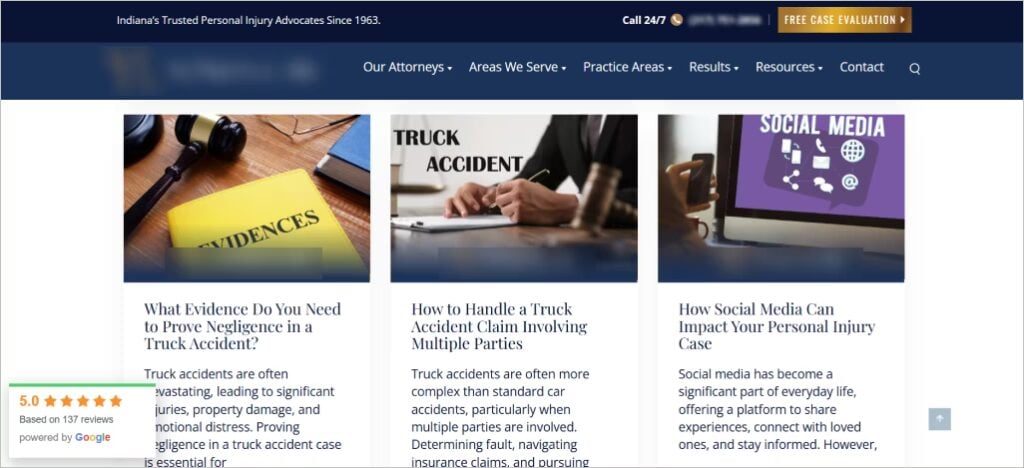
Clients are Googling, “What to Do After a Car Accident in [City]?” or “DUI vs. DWI: What’s the Difference in [State]?” Why not let your blog answer that for them? Keep it skimmable — short sentences, bullet points, plain English.
Pro Tip: Use online forums and Reddit: See what legal headaches people are posting about (e.g., r/legaladvice).
Videos
A 2-minute video on “How Long Does a Green Card Application Take?” could be exactly what a stressed-out client needs. You don’t need fancy cameras — just good lighting and clear audio.
Case Studies & Testimonials
Would you trust a lawyer who has no client reviews? Spotlight a case study on how you won a $250,000 settlement or a carousel of 4.5+ star reviews on your website.
Downloadable Guides & Tools
People love resources they can save. A “Bankruptcy Checklist” or a “Personal Injury Settlement Calculator” gives them something practical — and keeps your name in front of them long after they leave your site.
Podcasts & Infographics
Got lots to say? Podcasts are great for commuters and business owners. And if you want to simplify something complicated, try an infographic — “Steps in a Divorce Case” at a glance beats ten paragraphs any day.

At the end of the day, creating content isn’t complicated. Be sure to kick off with a game plan before you get to writing.
5. Demonstrate Authority with E-E-A-T
In Google’s eyes, law isn’t just another topic.
It falls under the “YMYL: Your Money, Your Life” category.
That means your content directly impacts people’s finances, freedom, and future. If Google doesn’t trust you, it won’t rank you. Period.
Enter one of Google’s top ranking factors… E-E-A-T: Experience, Expertise, Authoritativeness, and Trustworthiness.
To prove your E-E-A-T, put attorney bylines, bios, and credentials in your law firm content. This tells both Google and readers you’re legit. Add reviewer notes if another lawyer fact-checked the piece.
Then back it up. Cite statutes, case law, or credible sources like the ABA. Use stats to support your points. A blog on DUI charges hits harder when it links to current state laws.
6. Optimize Pages with an SEO Checklist
Writing great content is 50% of the battle. If no one sees your content, it won’t drive leads.
After all, 75% of users never scroll past the first page of Google.
So, let’s talk about search engine optimization (SEO). This pushes your content to the top of Google when people search for answers related to your legal services. Here’s how to do it correctly:
1. Nail Your On-Page SEO
- Write keyword-rich meta titles and descriptions. Example: “Immigration Lawyer in Dallas – Green Cards, Visas & Citizenship | [Firm Name].”
- Use clean, readable URLs like /immigration-lawyer-dallas/.
- Add image alt text: “Dallas immigration attorne y helping client with visa paperwork.”
- Place keywords naturally in headings, intros, and body copy.
2. Build Internal Links & Clusters
Connect related content so Google understands your site structure. Example: a blog on “What to Do After a Car Accident” should link to your main Personal Injury page, plus related posts on insurance claims or medical bills.
3. Earn Backlinks
Links from credible sites boost your authority. Try guest posting on local business blogs, submitting to bar directories, or earning mentions in legal news sites.
4. Target Google Featured Snippets
That “position zero” box at the very top of Google can skyrocket traffic. Format answers in bullets or short paragraphs. Example:
Q: What should I do after a car accident in Illinois?
A: Call 911, seek medical help, exchange insurance info, and contact an attorney.
5. Keep Content Fresh
Update posts with new laws, stats, or FAQs. Add schema markup for better listings. Use analytics to refine performance.
You can get new leads from your law marketing blog… just follow these simple steps!

Boost Your ROI to 400%+ Get more leads with our top-tier SEO, PPC, and web design services!
Book a Free Consultation7. Promote Your Content Across Channels
Now that you’ve published great content… let’s promote it!
Promotion is what brings you leads from your legal content creation. The right distribution strategy can keep paying off for months (or even years).
Here are the smartest ways to get your content in front of the right audience:
Social Media Platforms
Yes, social works for lawyers if you use the right platforms.
- LinkedIn for thought leadership, case updates, or business law insights.
- Facebook for personal injury, family law, or criminal defense; areas where everyday clients search.
- Instagram & TikTok for quick legal tips or short video explainers that grab attention.
Pro Tip: Don’t just drop an article link. Add a key takeaway, quote, or mini-summary to give people a reason to click. Posts with images or videos get 2x more engagement.
Email Newsletters
Still one of the highest-ROI channels — firms see an average 3,600% return ($36 for every $1 spent). Use newsletters to share blog posts, videos, or guides, answer FAQs, or showcase recent wins.
Legal Directories
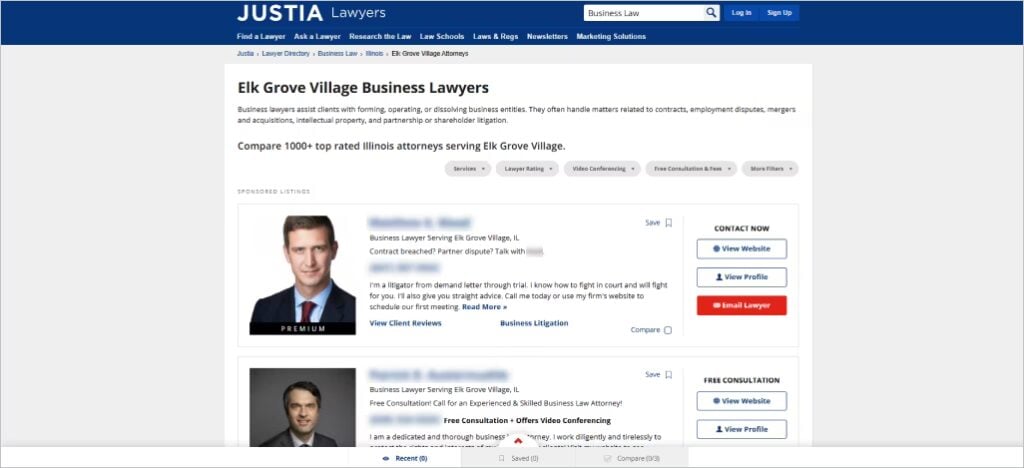
Directories like Avvo, FindLaw, or Lawyers.com boost visibility and backlinks. Many let you publish articles directly, expanding your reach and strengthening SEO.
Internal Links on Your Website
Every new post is a chance to link back to FAQs, related blogs, or service pages. This guides readers deeper into your site and helps Google understand your authority.
Guest Features & Partnerships
Don’t keep your best work locked on your own site. Write for bar associations, collaborate with referral partners, or guest on a legal podcast. Cross-promotion introduces your content to new audiences.
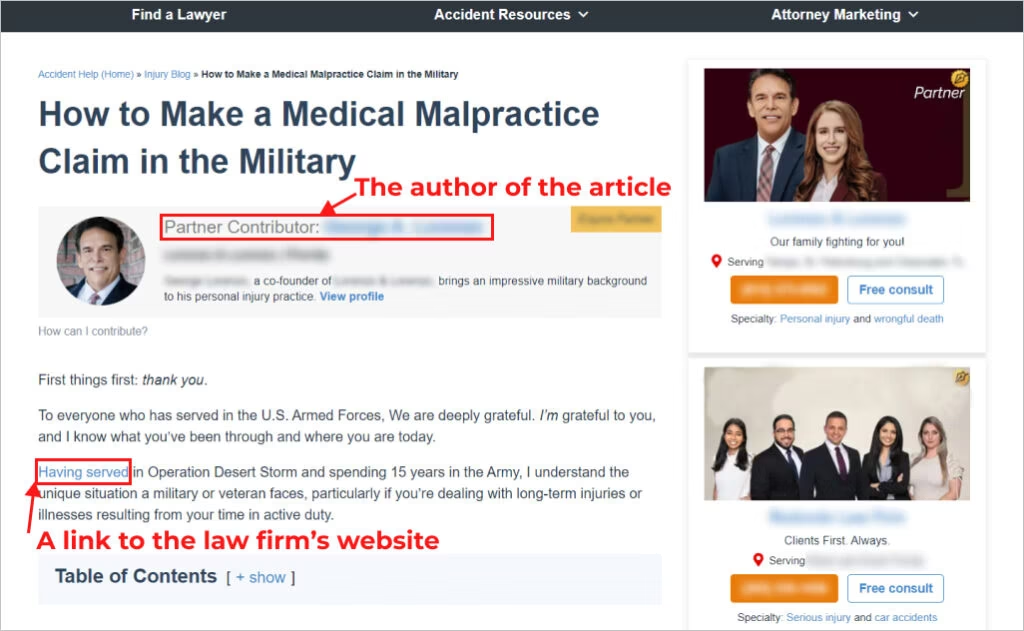
The takeaway: Share your content across multiple channels, and your hard work will keep attracting, nurturing, and converting clients long after launch!
8. Refresh, Repurpose & Distribute Your Content
You don’t always need to start from scratch. Some of your best-performing content might already exist… it just needs a little love.
HubSpot found that refreshing old blog posts boosted traffic by 106% on average!
So, let’s say you have a blog on DUI laws from 2020. Update it with current statutes, add a recent case, and republish across channels. Then, repurpose it:
- Blog → infographic → LinkedIn carousel → email snippet
- Blog → YouTube short → Instagram Reel → Q&A on Avvo, Reddit, or HG.org
- Blog → downloadable checklist or FAQ guide
Repurposing your legal marketing message gives it more mileage.
But repurposing isn’t just about efficiency — it’s about alignment. Attorney content marketing should tie into your entire strategy. That means consistent branding across blogs, ads, and emails.
Big picture thinking brings you business! Check out how to build a 360-degree law firm marketing plan to book clients faster.
9. Use AI to Speed Up the Content Production (With Review)
If you’re skeptical about AI, you’re not alone. Just remember, AI isn’t here to replace your expertise — it helps you scale it.
With the right prompts, tools like ChatGPT, Jasper, or Copy.ai can:
- Draft blogs, FAQs, or practice area pages in minutes
- Repurpose old content into videos, LinkedIn posts, or emails
- Suggest long-tail keywords and optimize meta descriptions
- Generate fresh ideas for articles, newsletters, or client handouts
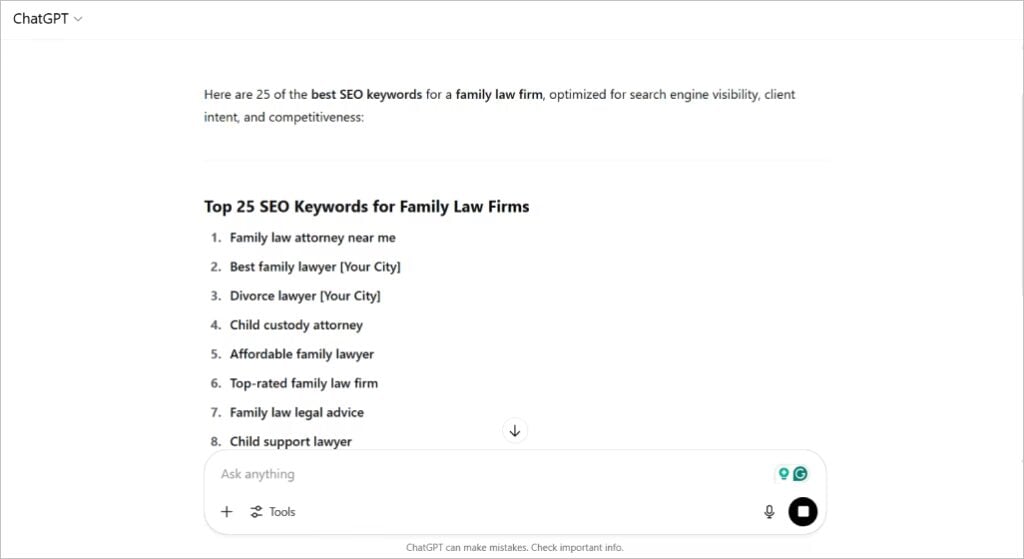
AI is your trusty assistant… except it won’t catch jurisdiction nuances or your firm’s voice, only you can do that.
Let AI take care of the repetitive stuff so you can focus on strategy. That’s how you leverage AI to devise an exceptional attorney content marketing plan.
To help you get started, check out the top 25 AI tools for lawyers in 2026.

Fill Your Pipeline Faster. Skip the stress. We deliver up to 1,018% more leads and a 400% ROI at Comrade.
10. Improve UX So Your Content Can Convert
You could publish the best article in the world, but bad news…
If your site is slow, clunky, or confusing, visitors will bounce before they ever read it.
Great website content for lawyers only works when paired with a smooth user experience. Here’s what to prioritize:
- Mobile responsiveness: Over 63% of legal searches happen on phones. If your content isn’t mobile-friendly, you’re losing leads.
- Fast load speed: Even a one-second delay can drop conversions by 7%. Speed isn’t optional.
- Clear CTAs: Don’t make people guess. Whether it’s “Call Now,” “Schedule a Free Consultation,” or “Download Our Guide,” every page should guide the next step.
- Easy navigation: Make practice areas, blog posts, and FAQs simple to find. If users can’t reach the info they want, they’ll leave.
Optimize your UX, and you’ll maximize your law firm content marketing results.
We all need a little inspiration! Check out the top lawyer websites.
11. Measure Your Legal Content Marketing Performance
Whew! That was a lot of hard work — blogs, videos, guides, the whole nine yards.
But here’s the million-dollar question: did it pay off? Let’s find out.
The Metrics That Actually Matter
- Website Traffic
Are more people finding you? If traffic isn’t climbing, it might be your topics or SEO. Fun fact: firms that blog regularly see 55% more traffic than those that don’t. - Engagement
Okay, they clicked — but are they sticking around? Bounce rate, time on page, and scroll depth tell you if people are actually reading. An under 40% bounce rate is excellent. 1:30–2:30 minutes on the page is solid. - Conversions
This is the meat and potatoes. Are visitors turning into calls, form fills, or consultations? The average legal site converts at 2–5%, but the best hit 7%+. Even a 1% lift can mean thousands more in revenue!
Tools to Make It Easy
- Google Search Console → See which queries get you found.
- GA4 → Track traffic, conversions, and user behavior.
- SEMrush / Ahrefs → Spy on competitors, track backlinks, and monitor rankings.
- Heatmaps (Hotjar, Crazy Egg) → Watch where users scroll, click, and drop off.
Content marketing for lawyers is part creating and part improving with every post.
Turn Content Into Your #1 Client Engine
Ready to attract bigger cases and build a well-fed pipeline?
Join forces with Comrade! As a trusted law firm marketing agency, we bring a combined 80+ years of experience with top-tier content marketing for law firms.
Our clients see:
- Up to 1,018% more qualified leads
- An average of 400% returns on their marketing investment
- A steady pipeline of clients week after week
Don’t let your competitors take your leads. Act now to secure your pipeline!
