Our eCommerce Marketing Agency will help you improve traffic and conversions
62 reviews
Get Your Free Consultation
Convert Traffic into Paying Customers
eCommerce businesses face many challenges. Competition is fierce. Getting visibility, maximizing conversions, and doing it all at a respectable profit margin is a science. There are myriad challenges that could be prohibiting you from improving your site performance:
Poor website architecture
Dated design and poor UX
Lackluster eCommerce SEO
Technical issues with your website
An effective eCommerce marketing agency can help you solve these problems by applying years of cross-industry experience and tactics to drive traffic, customers, and profit.
More than 68% of all online activity begins online. Furthermore, SEO boasts a conversion rate of 14.6%, much higher than outbound marketing’s 1.7%.
Thus, SEO is among the key eCommerce marketing strategies for increasing revenue. In order to achieve higher rankings on Google and other search engines, Comrade’s experts create world-class content and optimize it using just the right keywords. Our solutions are rock solid, guaranteed to work, and have already helped over 300 clients.
You can drive new customers and sales for your business with PPC because it is an incredibly effective, cost-efficient, and fast-acting marketing tool. The ability to target specific audiences makes paid advertising so unique among ecommerce marketing services.
Due to the fact that you only pay for clicks, PPC is highly cost-effective. PPC services generate ROIs of 4x-10x for many businesses that sell services and products. Complementing your SEO strategy with it can be extremely beneficial.
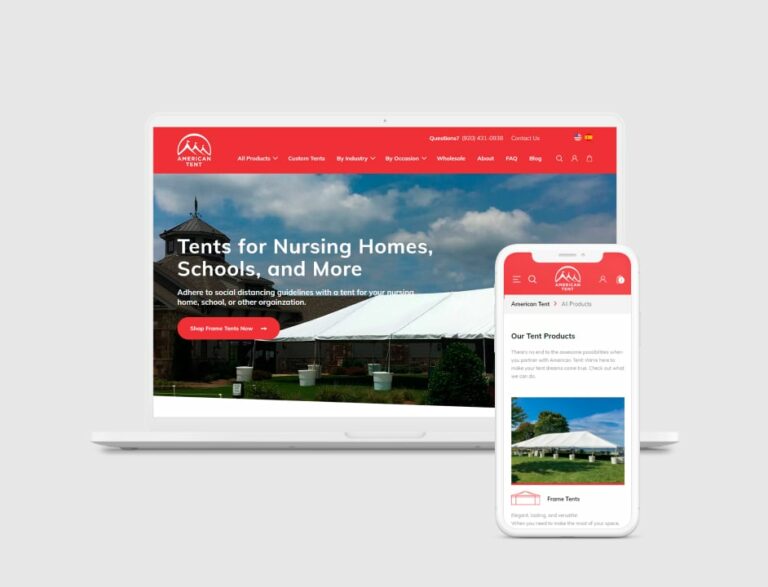
Whether your online store sells sports equipment or glasses, our team of eCommerce web developers works to leverage your brand and deliver on the objectives of your eCommerce website.
We analyze your competition, unique business objectives, and target audience to create an eCommerce website that will increase your revenue. We take your eCommerce web development project to heart and work in tandem with you to deliver results.
Since Google SEO relies heavily on content, it’s imperative to have content marketing services to support the development of strategies, tools, evaluation, and analysis necessary to execute marketing campaigns or programs.
Our SEO services at Comrade are designed to ensure that you receive high-quality, compelling, and relevant content in order to help boost your search engine rankings.
Conversion rate optimization (CRO) helps you understand your customers better and lower customer acquisition costs. It is a cost-effective strategy that leverages website traffic to increase profits.
Experts at our ecommerce marketing company systematically apply best practices and proven tactics to increase the effectiveness of calls to action, form fills, purchases, click-throughs, and sign-ups across website and marketing assets. This results in highly qualified leads and better ROI.
Reputation Management
Your reputation can be severely damaged by negative comments, reviews, and blogs on social media.
In order to analyze online mentions for your brand with an eye toward positive and negative sentiments, we use world-class social media monitoring tools. Following the creation and implementation of a unique reputation management strategy, our eCommerce marketing company ensures that the conversation around your business remains positive.
To Get the Results You Need an eCommerce Marketing Plan
Request a complimentary audit (with top eCommerce marketing strategies) that will show how we will help your eCommerce business reach the next level
For 12 years running, we’ve helped B2B and B2C eCommerce businesses in a wide range of industries overcome every type of challenge, increase their revenue, and grow their companies beyond what they thought possible.
B2B Ecommerce
B2C Ecommerce
C2C Ecommerce
Single Brand Website
Online Retailers
Marketplaces
Dropshipping
Subscription
Wholesaling
332 clients and counting rely on Comrade Marketing Agency
Comrade built me an awesome website from scratch, took over all marketing work. Few months into it, customers and revenue growth is way up. They successfully implemented the project. Thank you, guys.
Jake Spike
Founder / Spike Look
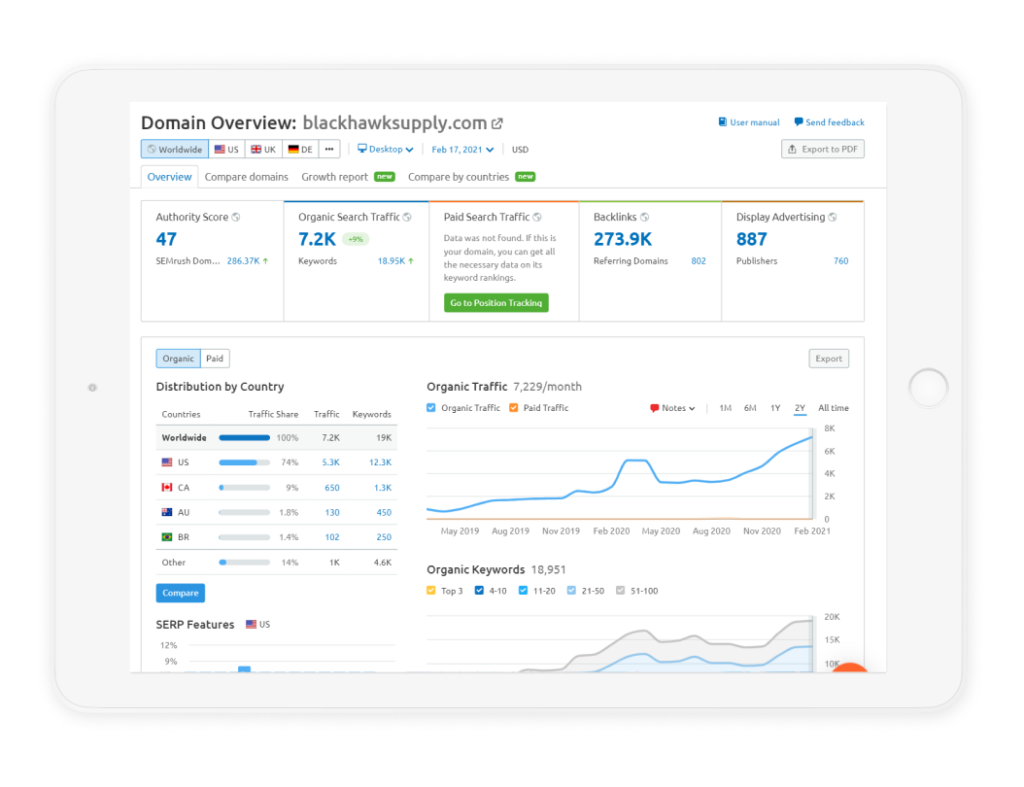
Professional web design and digital marketing company, that clearly understands e-commerce and has been a strategic partner in our company growth.
Jo Ann
COO / Blackhawk Supply
Both sales and positive feedback on the design of the site have increased. Comrade Digital Marketing was extremely responsive throughout the engagement and met every deadline. Their synergistic approach set them apart.
Eugene Seelin
General Manager / Nut Stop
Very strong web design and development team. Highly attentive to detail and provides great care to ensure client needs are met.
eCommerce businesses require a unique set of marketing solutions to effectively deal with the unique challenges they face and grow revenue.
At the heart of every successful online marketing campaign for eCommerce brands are five straightforward, yet incredibly effective steps. Be sure to implement the following solutions in your own eCommerce and you’ll be glad you did.
1. Ecommerce Marketing Strategy That Tracks Results
A full discovery phase is the cornerstone of all our eCommerce marketing campaigns, beginning with an audit of your business, revenue goals, market landscape, buyer’s journey, and more. Only once we can map out an attainable plan for success, complete with measurable goals to which we’re held accountable, do we sign on a new eCommerce marketing client. Make sure that any agency you hire does this.
Read More
We are among the few specialized eCommerce marketing agencies in the nation. As eCommerce is our specialty, we understand how critical it is to start a project by first creating a robust strategy with measurable goals.
2. High-Powered Ecommerce Web Design
Properly built websites are crucial to any business, but that is true 100-fold for an eCommerce. Your website is truly the foundation of your business, and any errors in website design or development will add up to a costly sum in lost revenue.
You need a high-performance website to maximize your conversion rate and seamlessly perform essential functions like engage buyers, track inventory, and help support your sales staff. Your site must also be beautiful, fast, easy to navigate and convey trustworthiness.
Our team has decades of combined experience working with eCommerce brands in just about every industry and is versed in all the best eCommerce platforms available. We’ll walk you through which one is right for your unique business and develop a site that makes sales processing a breeze for your staff and a pleasure for your customers.
Search engine optimization is what allows your eCommerce brand to be found online. And, simply put, poor website findability equates to poor sales. Ranking high on search engines, meanwhile, will transform your business and increase your revenue. We have helped many eCommerce clients secure first-page positions on Google and can very likely do the same for your business.
SEO is how your business will stand out from the competition, but to be successful, you need a team with experience in Google’s search algorithms and the latest search methodology. We are experts in all aspects of search engine optimization including: technical, in which we ensure your website is optimized and positioned to be properly indexed by Google; content marketing, which ensures compelling, informative copy enables your website to be “findable” on search engines; backlink building, through which trusted websites link back to your website, and more.
Rather than look for experts in each of these disciplines, you can hire our full-service eCommerce digital marketing firm that executes all aspects of SEO directly in-house.
Content marketing is both an essential component of SEO and how you communicate with your customers. Product & category pages, landing pages, blogs, expert guides, emails, and even social media ads are all part of your content marketing efforts. Prospects have questions about your products and through content marketing, you can preemptively answer those questions, driving them to your website and converting them into paying customers. This methodology, known as, “They Ask, We Answer,” is proven effective at increasing search rankings, organic traffic, customer trust, and revenue.
At Comrade, we generate content that answers your customers’ most pressing questions in a way that adds value to their lives and drives organic traffic, and, revenue, to your website. Our portfolio features dozens of eCommerce companies that have trusted us with their content marketing strategies, with stellar results. Content marketing is a powerful way to build brand loyalty and increase revenue in tandem.
PPC delivers a staggering 200% return on advertising spend and retargeting ads perform even better. PPC and retargeting ads are fantastic when you need to generate sales, fast. With these compelling stats in mind, it pays to consider adding PPC and retargeting to your digital marketing arsenal.
Take advantage of Comrade’s comprehensive eCommerce advertising strategies tailored to deliver a significant return on your investment. Our eCommerce digital advertising experts will assess the type, quantity, and length of ad-run needed to see results. As always, with PPC, your expenses are managed tightly, as you’re only charged when a prospect actually clicks on your ad.
According to research, roughly half of all abandoned shopping cart emails are opened, and over one-third of those clicked-on lead directly to a purchase on the home website. We will develop an email marketing strategy for your small business including content, delivery set-up, and email automation. Be sure to leverage this cost-effective, high-ROI tool.
Find customers, build communities, create fans: with eCommerce social media marketing, you can reach a lot more people who are looking for what you’re selling. Through clever targeting, engaging wording, promoting special deals, and encouraging reviews, we can get your social media to drive sales numbers.
Why Choose Comrade Digital Marketing for Ecommerce
Because having an expert eCommerce marketing company on your side will give you an extra competitive edge. Comrade’s specialists based in Chicago, Miami, and Los Angeles have over 11 years of experience in eCommerce marketing. Need a high-performance website? Check. Get more traffic? You got it! Improve conversions? Been there done that; will do it for you.
And, Comrade’s marketing services will come out free at the end, because we’ll generate a high return on investment that will more than pay for your marketing fees. Additionally, for the cost of one marketing employee not versed in important aspects of eCommerce marketing, you will receive an entire team of experts working on your project.
Web Design & Digital Marketing Questions Ecommerce Businesses Ask
What type of Ecommerce businesses do you help?
We help a wide variety of B2B and B2C eCommerce companies and have helped our diverse clients overcome every type of challenge. We help large enterprise organizations, but the majority of our clients comprise small to midsized eCommerce shops between generating $1M - $10M in revenue
Do you perform Ecommerce website redesigns?
Absolutely. We test your existing website's performance against industry standards and best practices. If we find that there are discrepancies in site performance, we will definitely suggest a site redesign. We also do full-scale platform migrations.
Do you offer a guarantee on Ecommerce marketing services?
We are one of the few ecommerce marketing companies that does. Proving our clients with peace of mind is paramount. As a priority, we stand behind our work with a guarantee rarely, if ever, offered in the digital marketing industry. Please schedule a consultation to learn more about our special package where we take on your project at half the agreed-upon budget until we meet your KPIs, at which point we revert to the normal monthly retainer.
What's the advantage of hiring your digital marketing agency over one of your many competitors?
First and foremost, we are trusted by our clients and have a proven track record of successful projects (please see our portfolio and case studies for details). As one of the best ecommerce marketing companies, we are respected by our peers (having been the recipient of multiple industry awards for excellence). We offer our clients a truly precedent-setting guarantee. We specialize in eCommerce marketing. We offer all of our solutions in-house -- no outsourcing. This means you'll get a truly comprehensive marketing effort, complete with experts in SEO, PPC, content, advertising, business strategy, web design and development, and more. We are transparent and accountable to you, the client, every step of the way.
How much do your Ecommerce marketing services cost?
We specialize in eCommerce marketing that delivers a high return on investment. That said, your particular budget will depend on how quickly you want to grow. We offer comprehensive digital marketing services for eCommerce ranging from $2,850-$6,250 per month and higher, for larger companies, those seeking more aggressive efforts or wishing to start working with more digital channels.
How long before my Ecommerce sees results from our marketing campaign?
While certain eCommerce marketing channels take a longer time to ramp up but provide a steady stream of qualified traffic (think search engine optimization), other avenues offer fast-acting results (think PPC). With this in mind, the solutions we've implemented on your particular project will ultimately determine how quickly you start to see results. On average, our eCommerce clients typically see real results ramp up from around the 90-day mark, and sooner with PPC campaigns.
Average clients see a 4.5x ROI
Request a Quote
Contact us to schedule a no-obligation digital marketing assessment of your eCommerce site. During our audit we’ll look at:
Website load speed
Performance of the platform and/or third-party plugins
Backlink quality
SEO
User Experience
Sales funnel structure
At the end of our assessment, we’ll deliver a custom, complimentary digital marketing plan tailored for your unique business.
Do you want a marketing plan that fits your individual needs? Let us craft a strategy that drives results to your company based on your objectives.
Please fill out the form to the right, and we will contact you within one business day for a free initial consultation.
[contact-form-7 id="144"]
Thank You For Your Interest!
One of our specialist will be in contact with you shortly.
Before you go, we would love to get additional information to help us better understand how we can serve you best. Please fill out this four question survey.
Unlock a full potential of your website. See which gaps in your marketing don’t allow your organization to scale. Get a complimentary, no obligation marketing performance review.
Digital Marketing Performance Audit
Unlock a full potential of your website. See which gaps in your marketing don’t allow your organization to scale. Get a complimentary, no obligation marketing performance review.